Using electrical signatures of CAN bus messages to reverse engineer cars

AvtoAd
09/11/2022
Quigley, D. Charles, R. McLaughlin
Warwick Control Technologies
annotation
There are many applications where you may need to reverse engineer a controller network (CAN), such as:
-
Analysis of automotive competitors;
-
Telematics applications such as fleet management;
- Disabled driver programs.
A typical reverse engineering process involves moving the sensor and watching the CAN bus messages change. For example, lower the door window and see if that changes the CAN message data.
Many CAN buses have many messages coming from many Electronic Control Units (ECUs). This means that it is difficult to view them all at once. It would be much easier if you could just watch fewer CAN messages to watch for changes, isolating the ECUs the messages are coming from.
This document describes a process that allows the user to determine which CAN messages are transmitted by a specific ECU. This is achieved by obtaining the electrical signature of each CAN message and matching known CAN messages to unknown ones. In this way, an ECU transmitting unknown CAN messages can be identified.
A method for determining which identifiers are coming from a particular ECU is to first obtain electrical signature plots of known diagnostic responses and compare with the electrical signature plot of real-time control messages. We show how to achieve this using Warwick Control's X-Analyser in conjunction with a PicoScope PC oscilloscope and a Kvaser CAN USB interface.
This document requires prior basic knowledge of how CAN bus technology works.
Content
1. What is the electrical signature of the CAN message .
2. Creating an electrical signature for each CAN frame.
3. Practical example – Reverse engineering of cars – Methodology of transmission ECU identification.
4. Conclusion.
What is the electrical signature of a CAN message
The electrical signature of a CAN message is unique in any message sent by the ECU. So you would expect all messages sent to the ECU to have the same electrical characteristics. For example, a CAN message consisting of CAN High and CAN Low voltages (CAN_H and CAN_L) must show something unique to each ECU due to the physical structure of the CAN bus (eg node position and distance on the bus).
Figure 1 shows the various fields that make up a CAN frame. Due to the contention-based nature of the CAN access method, the arbitration field (CAN ID) should not be considered for electrical signature, as this field may contain multiple ECUs communicating with each other and thus affecting the electrical signal.
After the arbitration process is complete, there is only one ECU that creates the data field. Here you see the unique electrical signature for this ECU. To obtain a unique signature for a CAN message represented by its transmitting ECU, measurements should be made from that part of the CAN frame when only one ECU is generating CAN data.

Figure 1. CAN frame design
To illustrate the unique electrical characteristics of each ECU in a vehicle, Figures 2 and 3 below show slight differences in CAN_H and CAN_L voltages for two different ECUs on a modern passenger car. They are called ECU A and ECU B.

Figure 2 ECU A - Electrical Characteristics
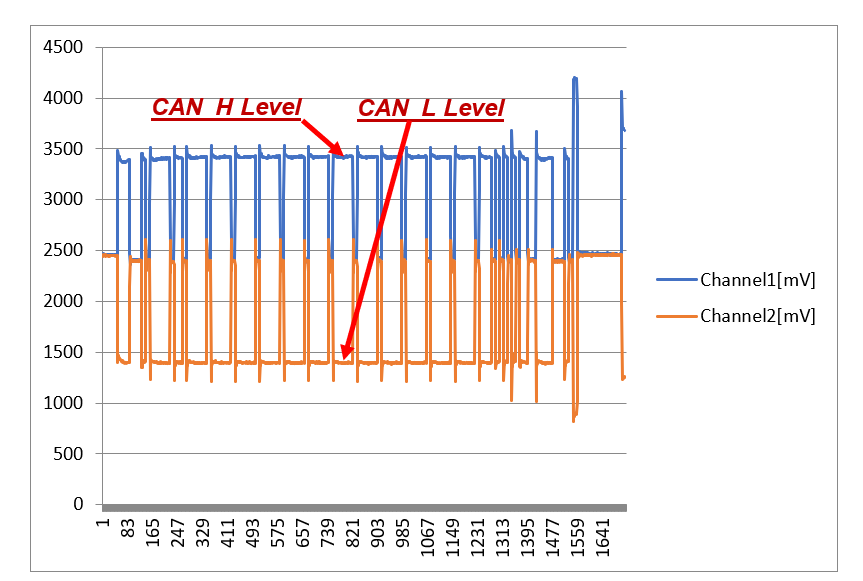
Figure 3 ECU B - Electrical Characteristics
It can be seen that the CAN_H and CAN_L voltage levels for the messages of these two ECUs are different.
Creating an electrical signature for each CAN frame
The methodology considered when collecting the electrical signature for each CAN message that allows us to identify the ECU it is coming from is to look at the CAN_H and CAN_L voltage values to link the messages to the ECU.
Method – Analysis of voltage CAN_H vs. CAN_L
Process:
- Log one sample oscilloscope trace of each CAN message
- Isolate only the data field
- Division of data field bits into dominant (logic 0) and recessive (logic 1)
- Calculate the modal average of CAN_H and CAN_L voltage levels for dominant bits only
The data is now ready for cluster graphs.
An example in X-Analyser
Figure 4 shows the display in X-Analyser using the PicoScope interface. Here you can see that the CAN frames are being logged in the upper half of the display. One of the CAN frames is selected (highlighted) and the physical signaling of this frame is displayed at the bottom of the display. Note that from this we can collect the voltage levels of the dominant bits in the data field (CAN_H, CAN_L).
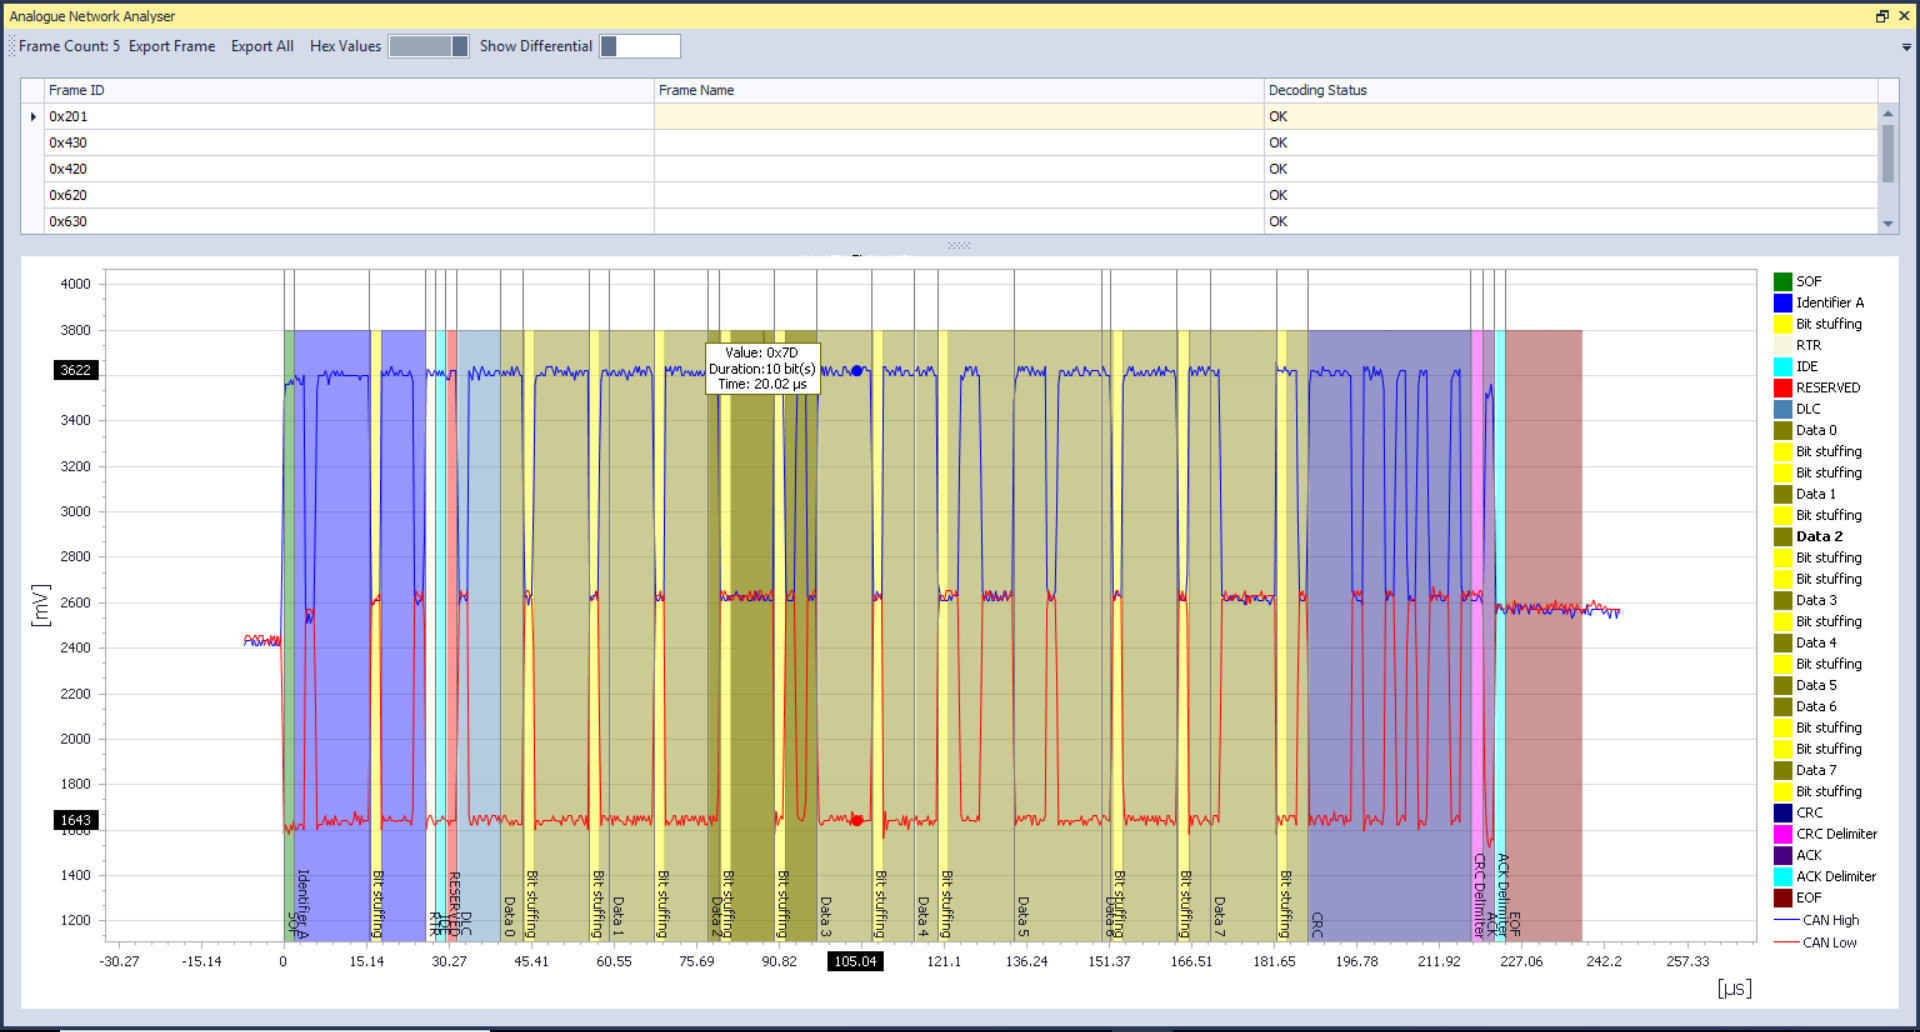
Figure 4 Highlighting a CAN frame on the PicoScope display
These waveforms can be exported as an Excel file to show the CAN frame reading at the sample point. This is done in X-Analyser using the Export Frame button to export the selected frame and the Export All button to export the entire frame from that collection. An example of the data being exported is shown in Figure 5.
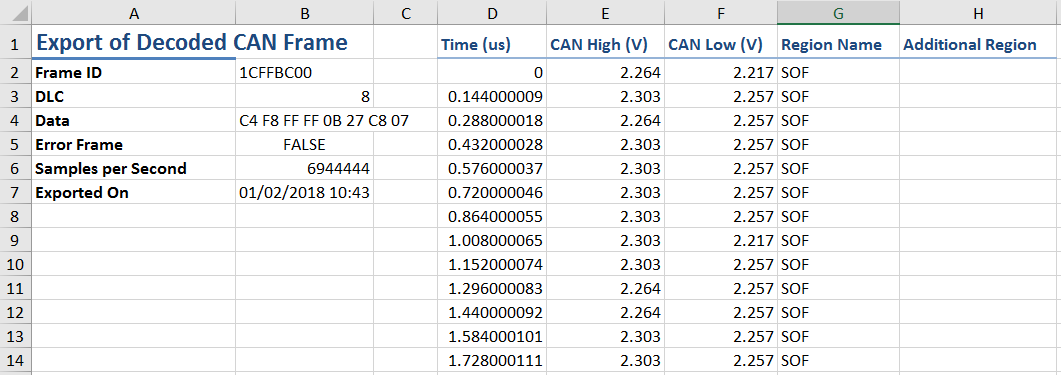
Figure 5 Example of Excel data exported for an extended CAN frame
Information provided in the Excel file:
- Frame ID (hex)
- DLC
- Data (bytes in hexadecimal)
- Error frame (true or false) (false if CAN frame is OK)
- Samples per second
- Exported (date)
- Time (sample for this frame, starts at zero)
- CAN-H and CAN-L voltages
- Name of the region (region of the frame in which the data is displayed)
- Additional area (shows where bit insertion occurs)
After exporting this information to Excel, we can calculate the cluster points using a method that takes the modal average of the CAN_H and CAN_L voltages from the data field (dominant bits only).
Data analysis and clustering
The data is analyzed by recording the voltage levels of the dominant CAN_H and CAN_L bits in the data field and obtaining a single modal average for CAN_H and CAN_L. These can then be placed on a cluster plot so that the clustering of CAN messages from a specific ECU can be observed.
The example below shows the data collection methods and the process used to construct clusters of CAN IDs based on Excel modal averages. This allows the researcher/engineer to find out which control units the CAN messages are coming from in real time.
Case study – Reverse engineering of cars – Transmission ECU identification methodology
The basis of this methodology is that each ECU on the CAN bus will exhibit its own unique electronic characteristics, which are affected by aspects such as its electrical components and tolerances, CAN transceiver, connector characteristics and location on the CAN bus. This can therefore be used to map unknown CAN frames to known CAN frames. In the automotive industry, real-time CAN control messages are proprietary. However, the diagnostic ID messages used for production and service garages are standardized in specifications such as ISO15765 [1] and/or between vehicle manufacturers.
It is well known that many vehicles using standard CAN IDs make a diagnostic request to the engine controller using CAN ID 0x7E0 and the engine controller responds with CAN ID 0x7E8.
Thus, a summary of the methodology is described in the following steps:
- Send diagnostic requests
- Get signatures of all replies and messages in real time
- Analyze and plot the data on a cluster diagram
Setting up reverse engineering equipment on a car
Figure 6 below shows an example of a hardware setup using the X-Analyser connected to the CAN bus via the Kvaser CAN USB interface and the PicoScope interface.
Referring to Figure 6, the Kvaser interface is used to generate diagnostic request messages and PicoScope is used to receive the diagnostic response message for physical signature analysis. The X-analyser software is used to generate ID 0x7E0 (or 0x700-0x7FF for other ECUs) transmitters via the object transmitter and uses the Kvaser interface to send these messages to the bus. PicoScope will see the transmitter sent (0x7E0) and read the response to this message with ID 0x7E8. 0x7E8 can then be analyzed with the Analogue Network Analyzer in X-analyser.
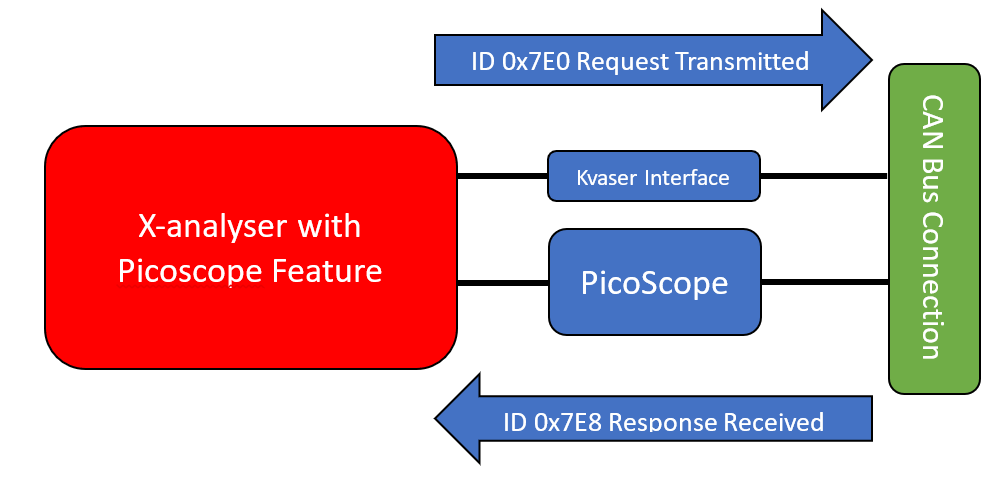
Figure 6 Connecting the X-Analyser to the car via the Quaser interface and the PicoScope PC oscilloscope
Diagnostic requests
Additional information on the diagnostic query can be found in ISO 15765-4:2016. The basic information required is that the diagnostic request has hex CAN IDs in the range 0x700 to 0x7FF. It is known that the standard emission diagnostic request message has an identifier of 0x7E0 and the expected response from the ECM (engine control module) has an identifier of 0x7E8. Referring to ISO 15765-4:2016, page 29, it is also known that the TCM (Transmission Control Module) diagnostic request ID is 7E1 and the response message is 7E9. Many other ECUs are manufacturer dependent, but most can be checked with a vehicle model specific OBD tool. For example, it is known that in many models the ABS ECU has a request of 7E2 and a response of 7EA.
The diagnostic response ID value will increment by 8 and give the response ie;
Request ID = 0x7E0 Response ID = 0x7E8 8 = 7E8 – 7E0
An example of a CAN frame diagnostic request 0x7E0 is;
ID = 0x7E0 DLC = 8 Data = 02 10 01 00 00 00 00 00
Therefore, we are waiting for a response from the emissions system (engine) ECU on CAN ID 7E8.
If the other queries are not answered, this means that this diagnostic function is not supported in this vehicle. The diagram in Figure 7 shows the message of the diagnostic response in the 1st car of the candidate. From this we established the electrical signatures of CAN ID 728, 7E8 738 and 768. The manufacturer's specification allows the functions of these ECUs to be established.
Data collection on X-Analyser and PicoScope
Clusters will show which messages are associated with the same ECU. The results of the two candidate vehicles are shown below.
Candidates 1 and 2 were electrically good CAN buses, ie good grounding and less noise. The methodology used here was to construct the CAN-H and CAN-L modal values from the data segment of the CAN frame to create the clusters shown. This modal value will be taken from the data field region for dominant bits only.
Using the CAN_H vs. CAN_L plotting method
Candidate 1
A diagnostic request message was sent to Candidate 1 's vehicle with the response results displaying the electrical signature shown in Figure 7.
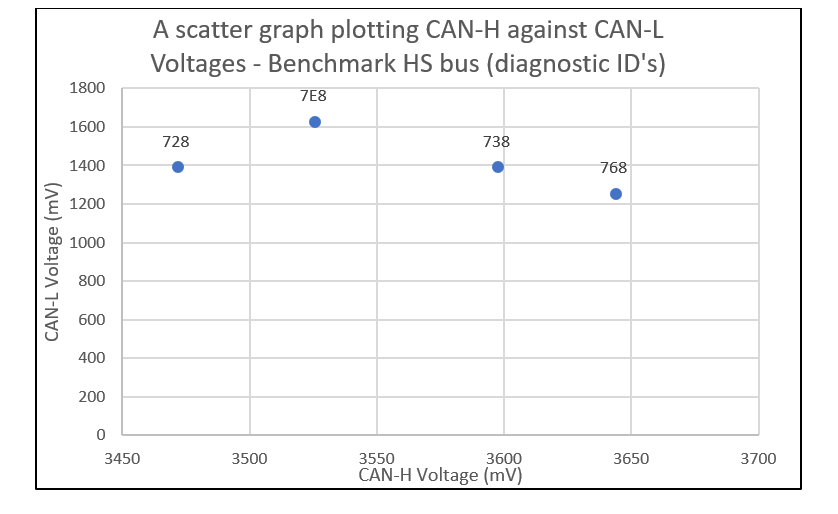
Figure 7. CAN Diagnostic Response Message Cluster Plot for Candidate Vehicle 1 - CAN_H Modal Voltage vs. CAN_L Modal Voltage
Here we plot the cluster points using CAN_H vs. CAN_L. According to the specification of this vehicle, the received diagnostic responses are interpreted as follows:
- 728 – Combination of devices
- 7E8 – engine ECU
- 738 – steering ECU
- 768 – ECU of the brake control module
After establishing the diagnostic response signature, we collected the real-time CAN control messages and constructed the electrical signature shown in Figure 8 below.

Figure 8 Real-time CAN message cluster plot for candidate vehicle 1 - CAN_H modal voltage vs. CAN_L modal voltage
Here, we found that the overall electrical signatures of real-time CAN messages closely match the diagnostic responses. In this way, we can verify that the messages are coming from the following ECUs:
- Instrument ECU – CAN ID 190, 275 430, 433, 460
- Engine ECU – CAN identifiers 200, 201, 205, 231, 268, 280, 420, 428, 4F0, 4F1, 4F3
- EHPAS ECU is 240
- Brake control module ECU - 20F, 211, 212, 4B0
This information will allow reverse engineering techniques to be used to help determine the function of these CAN messages. X-Analyser can extract these messages and perform various research methods to determine the function of individual signals in these messages.
Candidate 2
To further validate this method, a similar method was performed on a second vehicle for which the CAN specification was available. The result is illustrated in Figure 9 below, which shows the real-time electrical signatures of the CAN data for this vehicle.

Figure 9 Real-time cluster plot of CAN messages for candidate vehicle 2 - CAN_H modal voltage vs. CAN_L modal voltage
Here we can see that the messages are coming from the following ECUs:
- Braking ECU – CAN ID 091, 1AA, 1A4, 1B0, 1D0,1EA, 255
- Electronic instrument control unit - CAN identifiers 156, 18E, 1A6, 21E, 221, 294, 295, 309, 372, 374, 377, 378, 386, 405, 428, 42D 510
- Engine ECU - CAN identifiers 13C, 158, 17C, 1DC, 1ED, 320, 324, 328, 376, 3D7, 40C, 454, 465
- Airbag ECU – CAN ID 039, 305, 401
Conclusion
The method shown in this paper can be used as evidence for hypothesis testing during reverse engineering. Many times during reverse engineering exercises, we want to isolate CAN messages from a specific ECU. This method of constructing electrical signatures by noting the modal average of CAN_H vs. CAN_L for each message data field has proven to be a very good aid in this.
The approach shown in this article is not limited to CAN bus technology. CAN-FD is the obvious next bus to look out for. However, electrical signatures can be obtained for many other bus and network technologies, such as FlexRay, which uses a differential signaling approach. It may be possible to characterize the signals on the LIN bus. However, obtaining the electrical signature will require a slightly modified approach as it does not use differential signaling.
List of references
ISO 15765-4 (2016) – Road vehicles – Diagnostic communication over a controller network (DoCAN). Part 4: Requirements for emission-related systems . Using Electrical Signatures of CAN Bus Messages to Reverse Engineer Cars S. Quigley, D. Charles, R. McLaughlin Warwick Control Technologies Abstract There are many applications where you may need to reverse engineer a controller network (CAN), such as:
A typical reverse engineering process involves moving the sensor and watching the CAN bus messages change. For example, lower the door window and see if that changes the CAN message data.
Many CAN buses have many messages coming from many Electronic Control Units (ECUs). This means that it is difficult to view them all at once. It would be much easier if you could just watch fewer CAN messages to watch for changes, isolating the ECUs the messages are coming from.
This document describes a process that allows the user to determine which CAN messages are transmitted by a specific ECU. This is achieved by obtaining the electrical signature of each CAN message and matching known CAN messages to unknown ones. In this way, an ECU transmitting unknown CAN messages can be identified.
A method for determining which identifiers are coming from a particular ECU is to first obtain electrical signature plots of known diagnostic responses and compare with the electrical signature plot of real-time control messages. We show how to achieve this using Warwick Control's X-Analyser in conjunction with a PicoScope PC oscilloscope and a Kvaser CAN USB interface.
This document requires prior basic knowledge of how CAN bus technology works.
- Analysis of automotive competitors
- Telematics applications such as fleet management
- Disabled driver programs
Read also: